
January 1970 to April 2021
While every market experiences ups and downs, the downside of the Index was very little in comparison to the Housing and Stock Market adjustments. This is why it is Key to be diversified in many different areas and Rare U.S. Coins And Pre-33 GOLD are that place
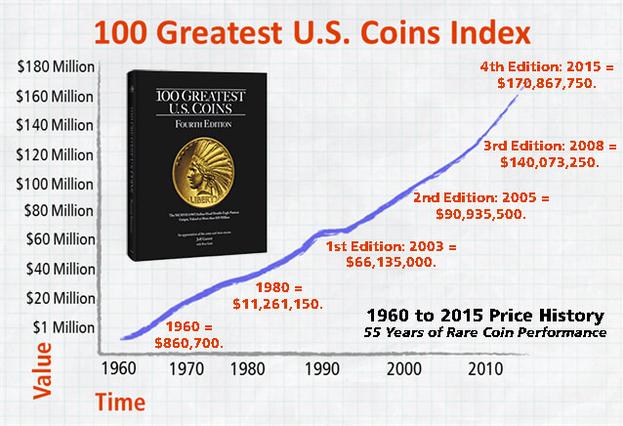
Price History Of The 100 Greatest U.S. Coins
1960 = $860,700
1980 = $11,261,150
1st Edition: 2003 = $66,135,000
2nd Edition: 2005 = $90,935,500
3rd Edition: 2008 = $140,073,250
4th Edition: 2015 = $170,867,750
Key Dates and Rarities
These charts show the values of Key Dates and Rarities of Rare United States Coins.
Charts courtesy of PCGS.

April 2020 to April 2021

Gold Spot Price
These chart the trends in gold, termed “Spot Price”
Charts courtesy of PCGS.
January 1970 to April 2021
April 2020 to April 2021

January 1970 to April 2021
April 2020 to April 2021
 in the Shuswap by